Model Visualization
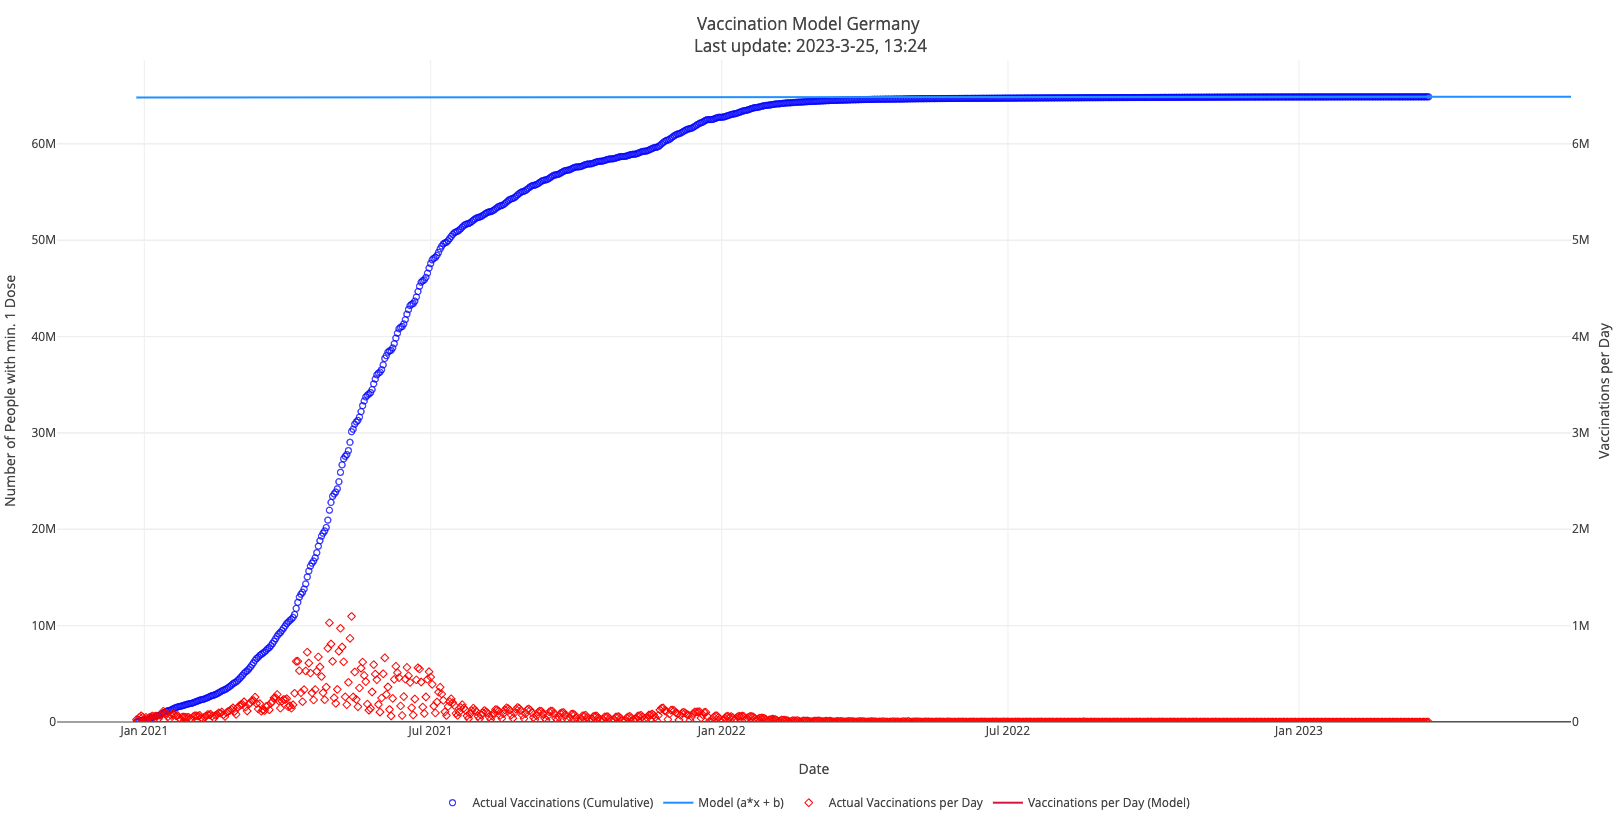
An attempt to model the vaccination progress in Germany (requires Javascript).
- The model tries to fit a degree 1 polynomial/line (
f(x) = a*x + b) to the offically reported vaccination numbers, considering only the last 60 days. I've been using a degree 4 polynomial (f(x) = a*x + b*x² + c*x³ + d) before because in the first months, the number of vaccinations grew rapidly. Now the number of daily vaccinations seems to have stabilized.. - The model aims to predict the day Germany reaches 73 M first-dose vaccinations. This number is just a rough estimation of the amount of people who will be able to get vaccinated based on some internet research.
- Use the zoom buttons in the top right corner to zoom out and see historical data since 2020-12-27.
- The number of vaccinations per day of the model is calculated as the first derivative of
cumulative model, i.e.,
f'(x) = a.
Data Source
https://impfdashboard.de/daten